Equities Research

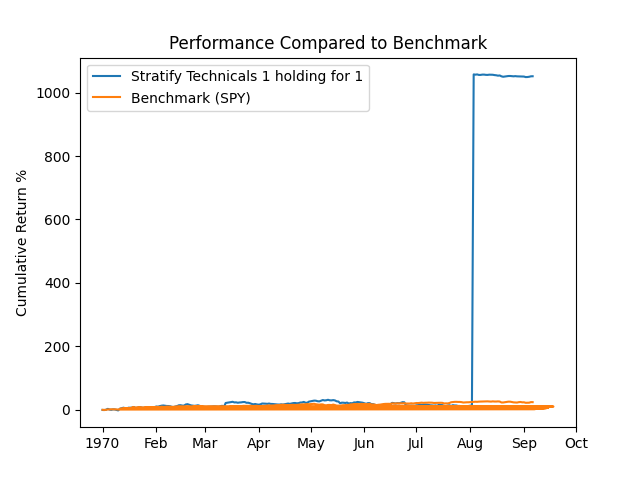
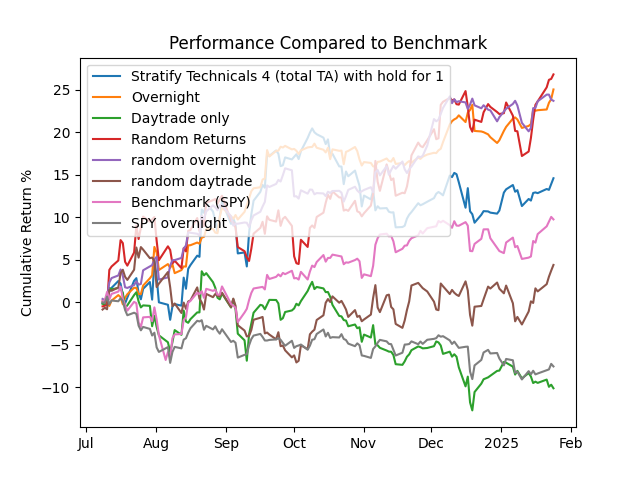
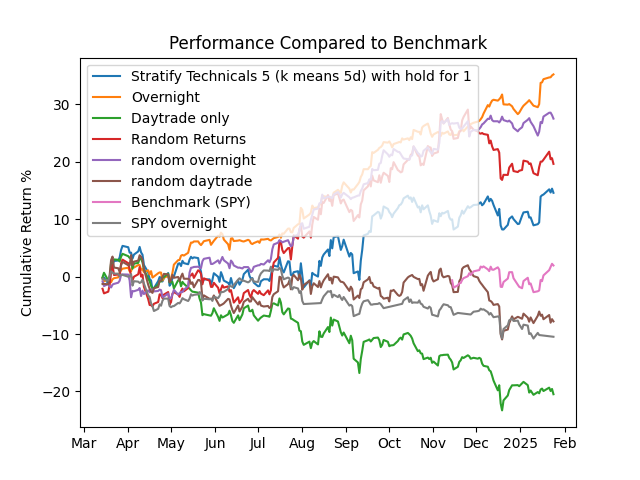
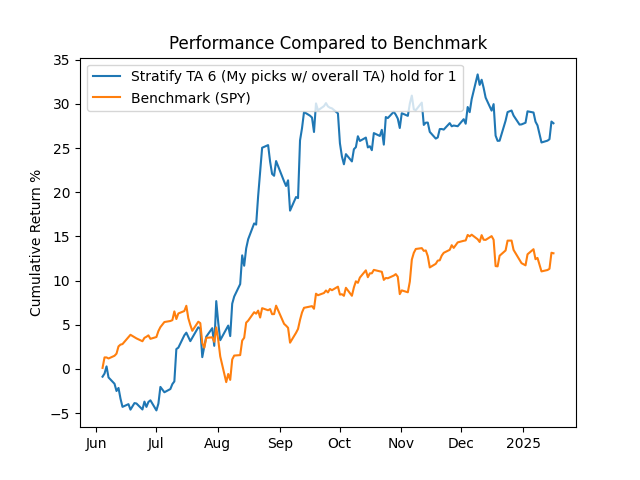
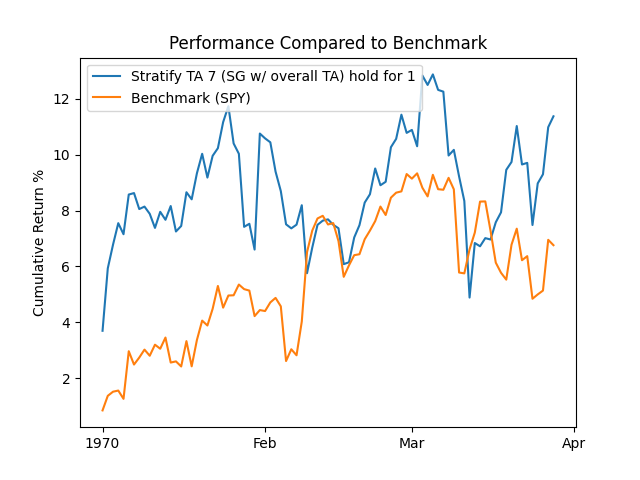
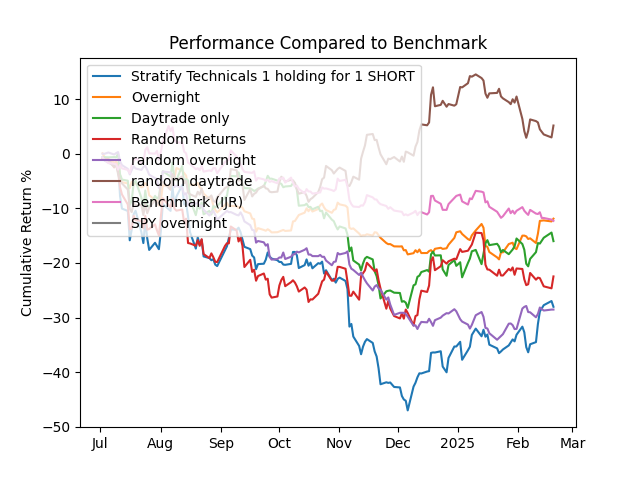
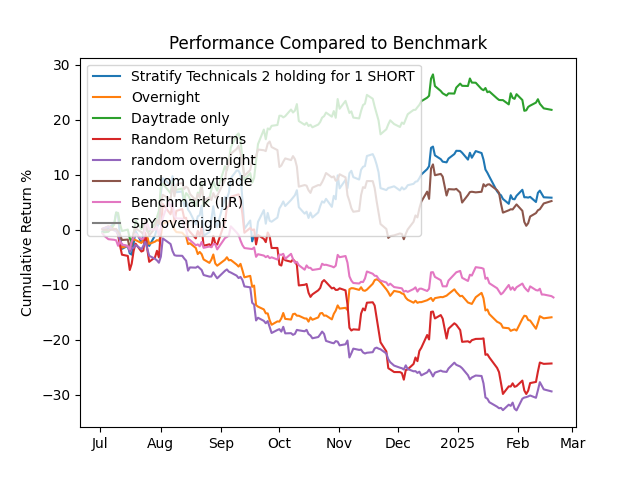
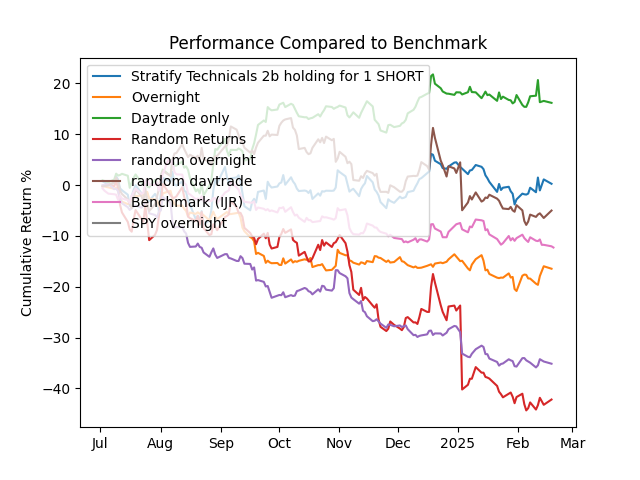
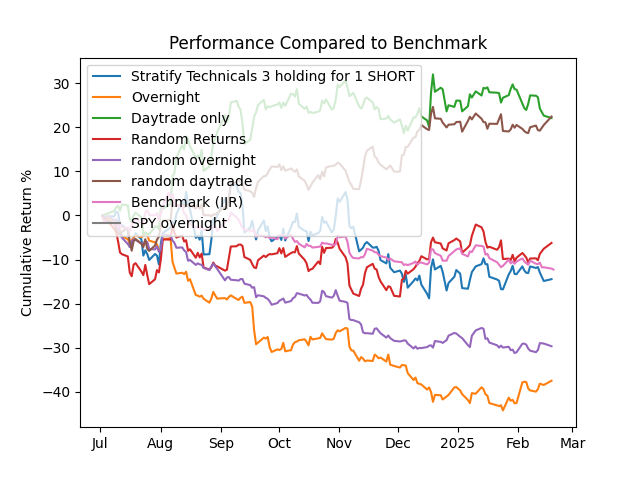
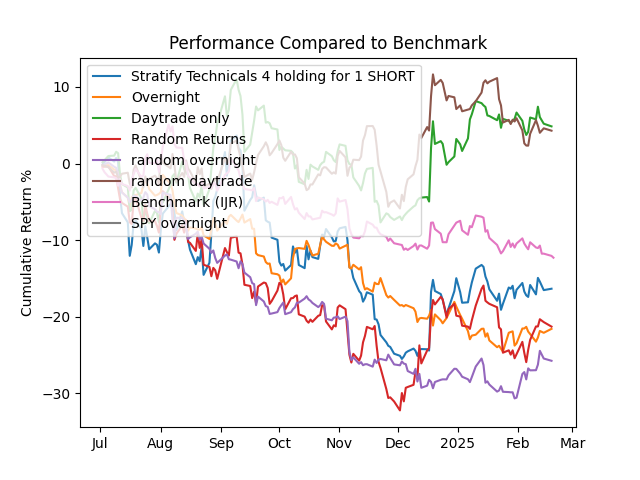
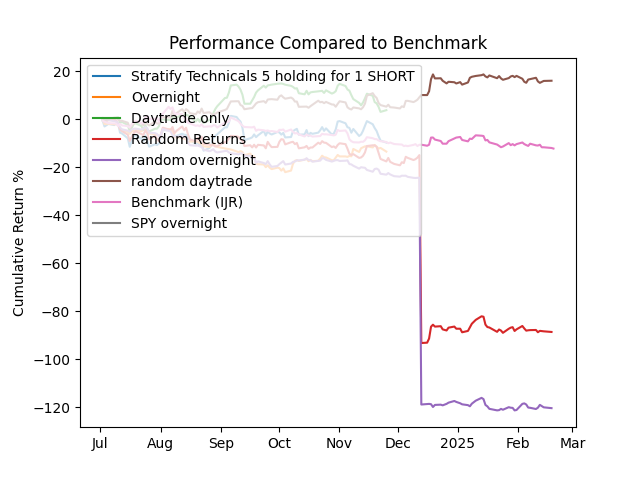
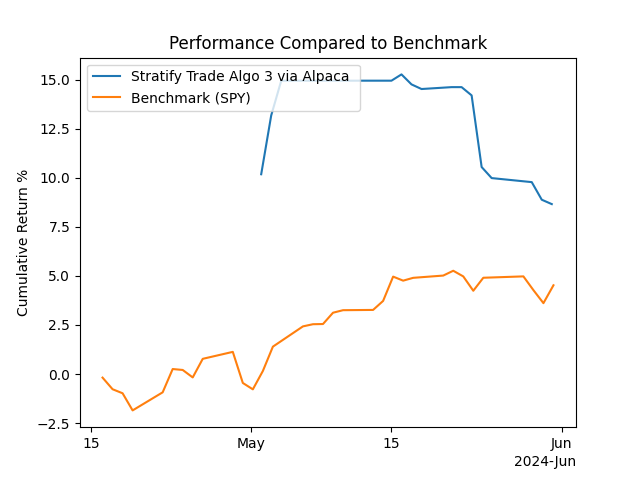
Each asset class shows several potential individual stock trade ideas based on mechanical scoring of both technical and fundamental indicators. The technical analysis was backtested over past 10 years based on 30 day returns.

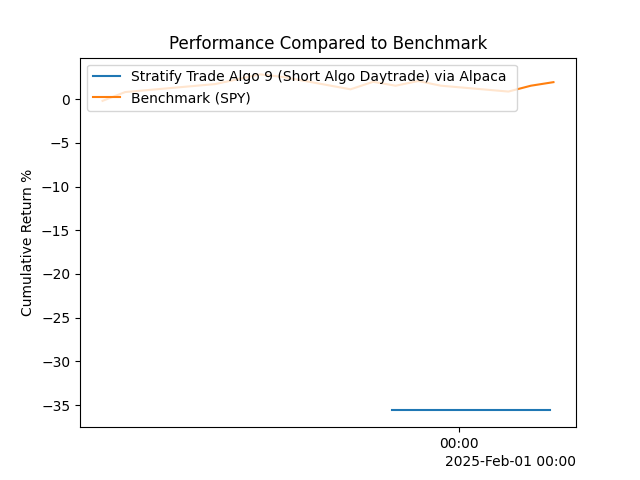
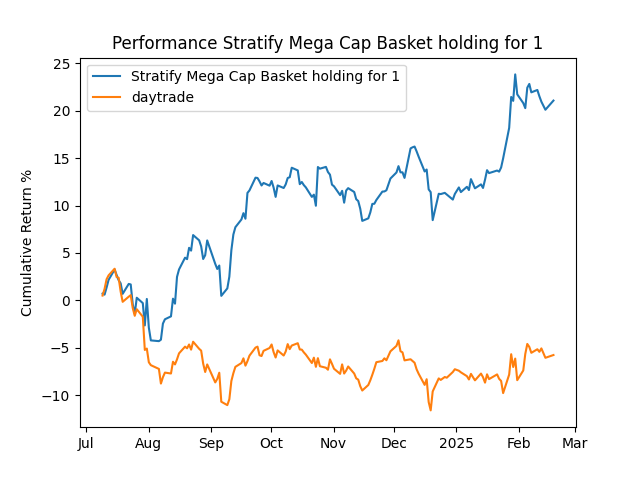
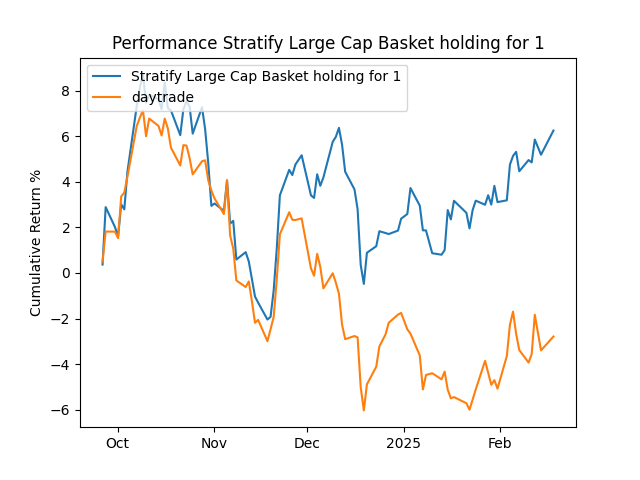
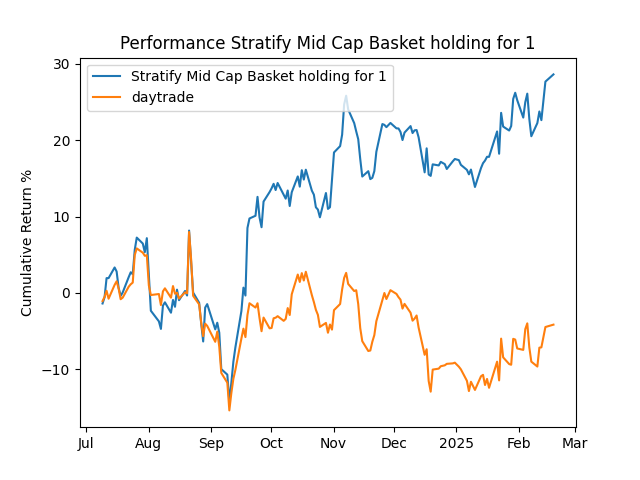
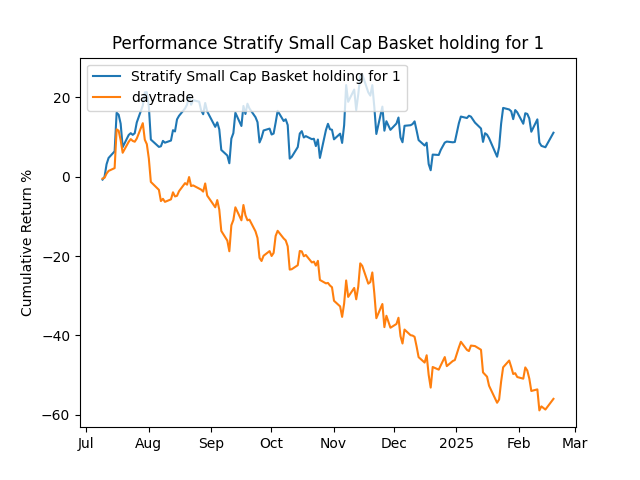
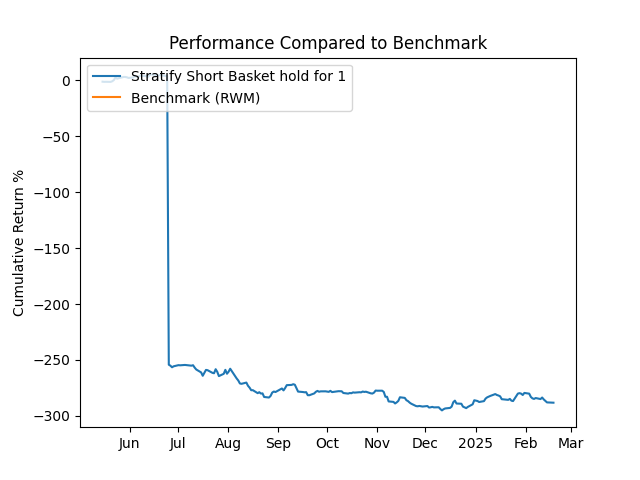
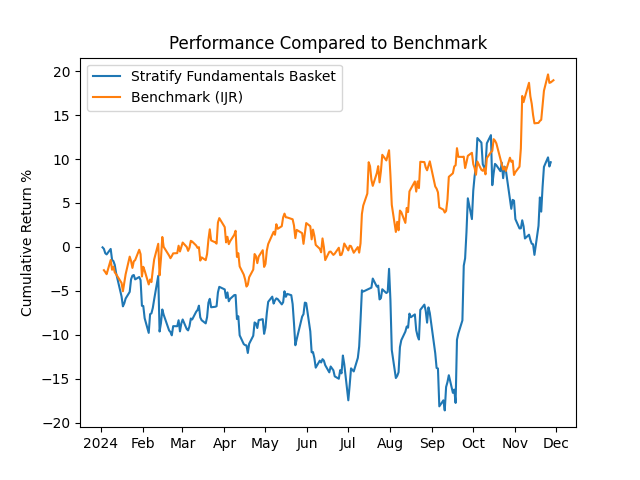
Note: The following should not be considered investing advice. The publisher makes no claims on the accuracy of the data provided. Full history is provided for transparency. The Stratify basket returns shown are estimates. Actual returns will vary because the actual execution of entry and exit prices. Estimates are based on assumption of entry the day that the ticker triggered at the market close price and exit after 30 days at the market close price.

Asset Classes

Updated February 28, 2025 21:09


Stratify Trades via Alpaca 3

1 best ticker with daily TA - hold until daily TA says sell


Contact for source code


Stratify Trades via Alpaca 6

Shorting top 10 worst stocks


Contact for source code


Mega Cap Stocks


View full history


Large Cap Stocks


View full history


Mid Cap Stocks


View full history


Small Cap Stocks


View full history


Short Book


View full history


Pure Fundamentals Analysis


View full history


Pure Worst Fundamentals Analysis


View full history


Pure Technicals Analysis


View full history


Pure Technicals Analysis - Overfit


View full history


Pure Technicals Analysis - Overfit 30


View full history


Pure Technicals Analysis - K Means


View full history


Pure Technicals Analysis - Avg All


View full history


Pure Technicals Analysis - K Means 5 day


View full history


Pure Technicals Analysis - My stocks with high TA score


View full history


Pure Technicals Analysis - SG stocks with high TA score


View full history


High Dividend Yielding Picks


View full history


Pure Technicals Analysis _short


View full history


Pure Technicals Analysis - Overfit _short


View full history


Pure Technicals Analysis - Overfit 30 _short


View full history


Pure Technicals Analysis - K Means _short


View full history


Pure Technicals Analysis - Avg All _short


View full history


Pure Technicals Analysis - K Means 5 day short


View full history


Disclaimer: This is not investment advice